You can buy a house for less money in the suburbs than you can in a big city, but the cost of commuting may kill almost all your savings. Some number-crunching by a public-spirited mortgage broker in the Toronto area makes this point quite clearly.
David Hughes, with the
Mortgage Group Ontario Inc., divides his clients into a couple of groups with respect to attitudes toward living in suburbia: One group wants to live in the suburbs and is fine with the idea of commuting, and then there are those who want to live downtown, but can’t afford the prices. “They either buy a fixer-upper, or they run screaming to the suburbs and living with the two cars.”
Now, he finds people talking more about the cost of two working parents commuting by car every day. He explains this shift as being a result of the bigger mortgages people are taking on, and the considerable cost of buying and owning a car. “Gas at $1.30 a litre will do that to you,” he said.
No question, you’ll find
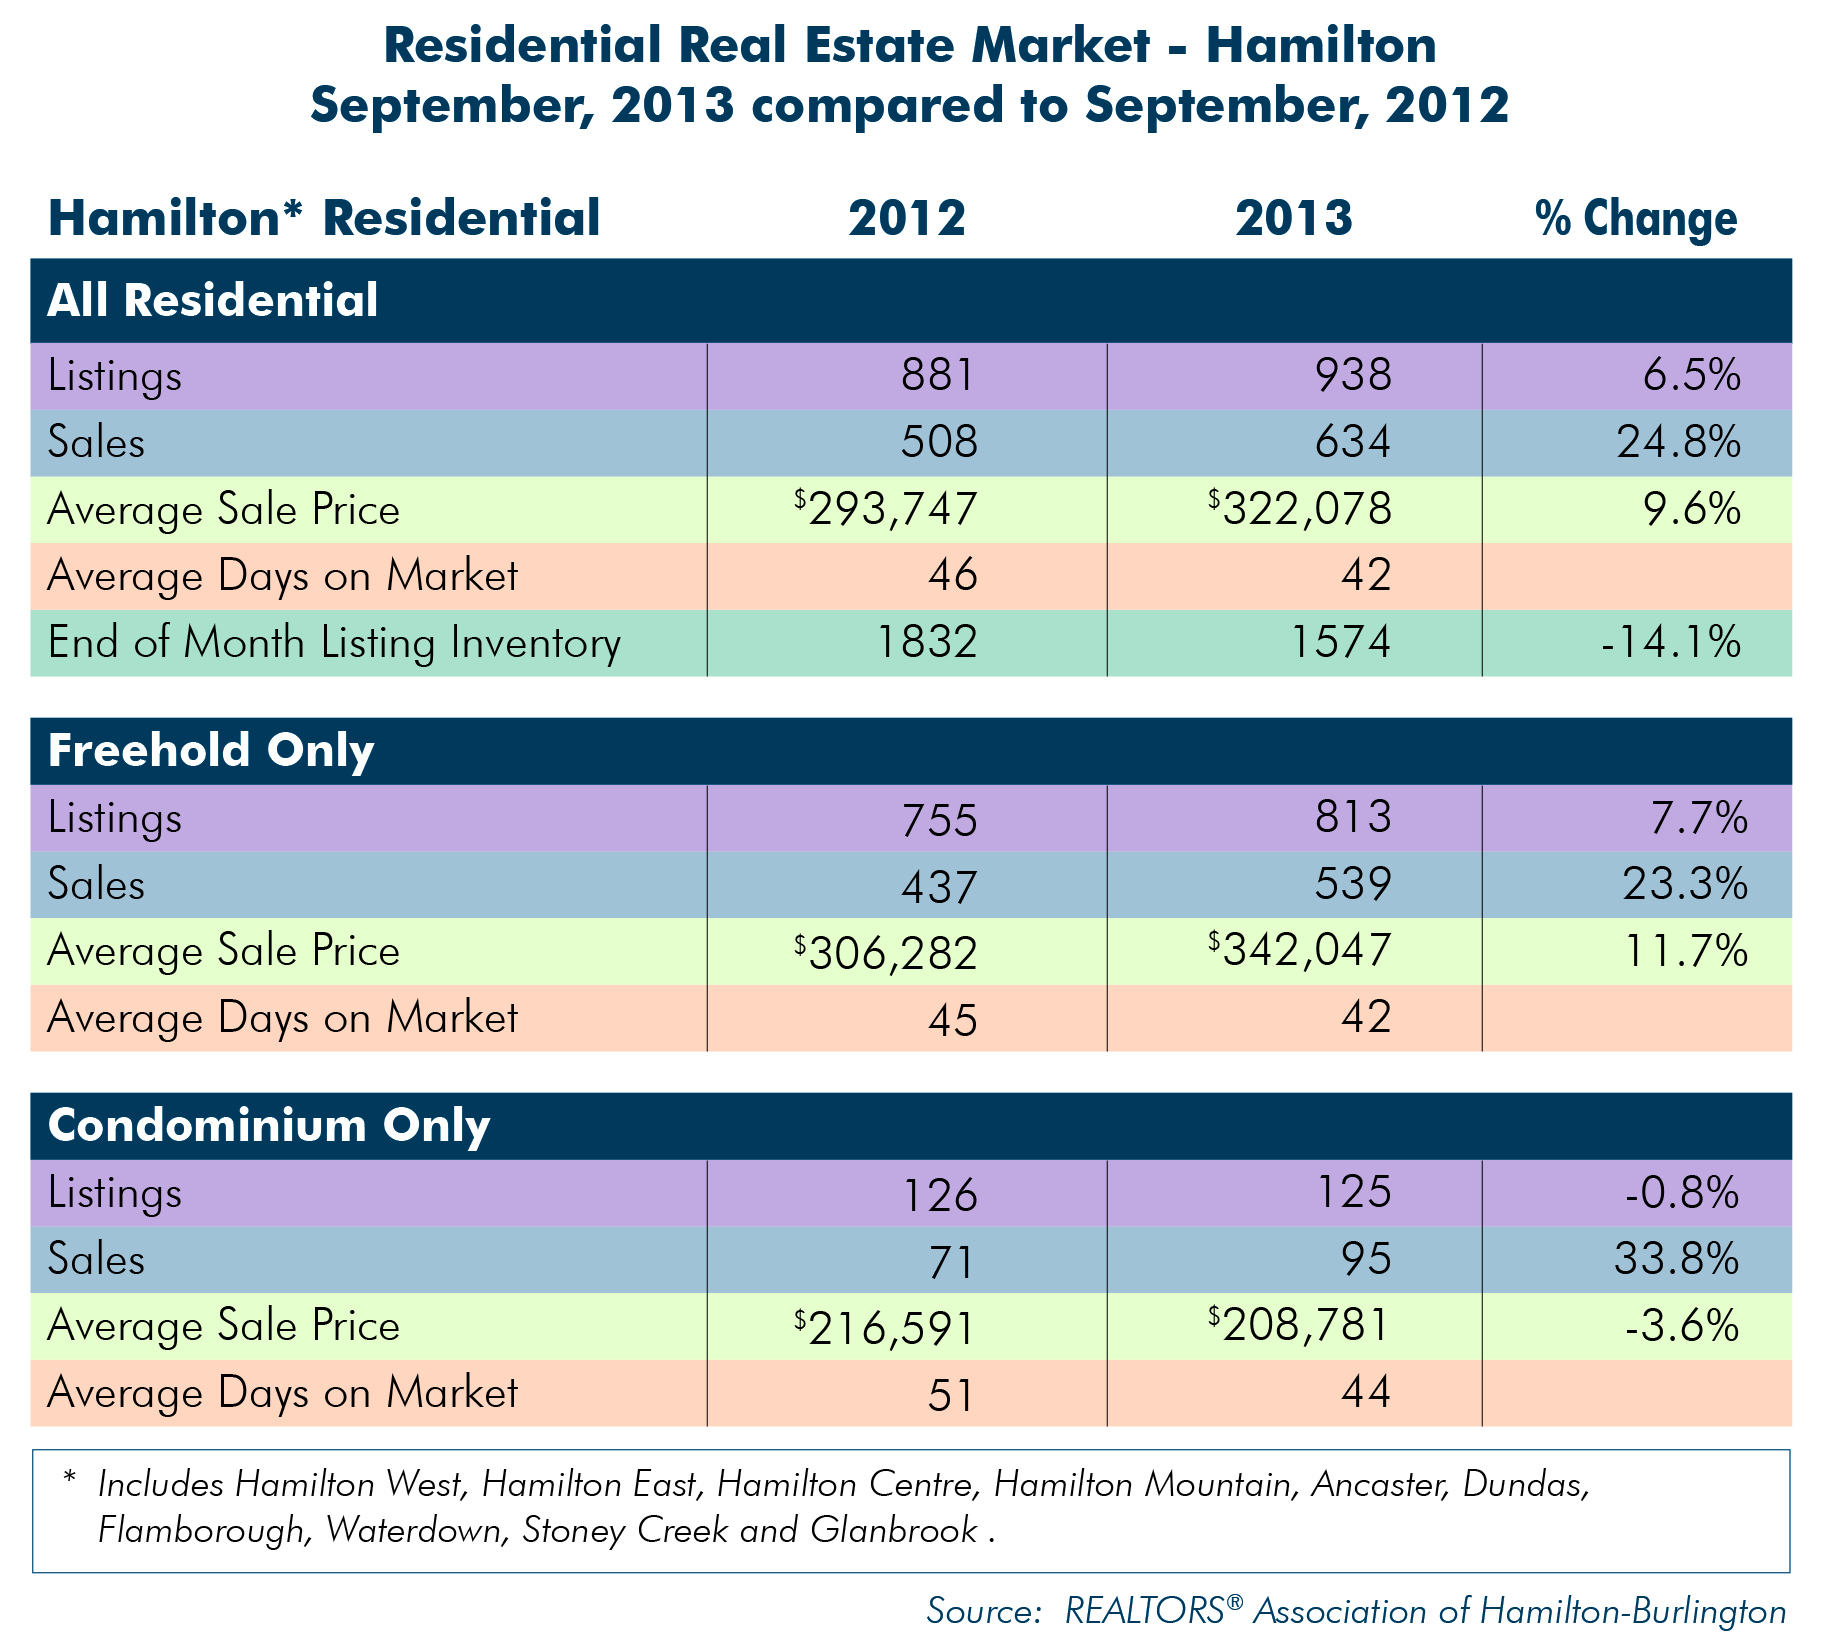
house prices are cheaper outside big cities. Toronto Real Estate Board numbers suggest a spread of almost $250,000 between city homes and those in the neighbouring suburbs. Suburban living loses its cost advantage if you have two adults commuting by car each day. Add the effect of stress and time spent in gridlock, and suburbia looks even more costly.
Imagine you’re part of a couple that has $50,000 for a down payment and must decide between a $500,000 house in the suburbs and a $720,000 house downtown. The suburban lifestyle comes with two cars in this example; the city dwellers get by with public transportation, taxis and car sharing or rentals. To keep things simple, we’ll assume here that your mortgage rate will be a constant 3.5 per cent and that you’ll take 25 years to pay it down.
Suburban living costs less in this example, but by only $63 per month if you add mortgage and transportation costs. And that’s with some conservative estimates by Mr. Hughes on car costs.
Using the 2013 edition of the Canadian Automobile Association as a guide, he set the annual cost of commuting at $9,500 a vehicle, or $19,000 for a pair. Included in these costs are variable factors such as fuel and maintenance, and fixed expenses such as insurance, licence and registration, depreciation and financing.
Your actual car ownership costs could be lower if you drive a reliable older vehicle that has been paid off. But you may well pay more. Mr. Hughes’s CAA numbers were based on owning two Honda Civics – many families are driving at least one fancier vehicle. The estimated total number of kilometres driven each year was in the low 20,000 range – you could easily drive further in a year if you have a long commute.
The downtown household pays $6,000 annually for a pair of monthly transit passes and occasional use of taxis, car rentals or car sharing. Maybe it’s not realistic to believe a family with kids can live downtown and not own a car. But while owning a car for periodic use makes city living more expensive, it doesn’t do a thing to mitigate the high cost of commuting from the suburbs.
The case for cheaper suburban houses is undermined most when you take a long view that factors in your transportation needs both before and after your mortgage is paid off. Mr. Hughes figured on the suburban household moving to just one car after the mortgage is done, while the downtowners stay car-less.
Let’s add up what happens over 40 years – 25 with a mortgage and 15 afterward. The suburban household pays a total of $1.3-million on mortgage principal and interest and transportation. The downtown household pays just a little bit less – $33,865, to exact.
If you plan to live outside the city where you work, commuting costs must be part of your housing affordability analysis. Mr. Hughes said he delicately makes this point to clients that come in with thoughts of suburban living. “I don’t want to see anyone impoverished by their choice.”