
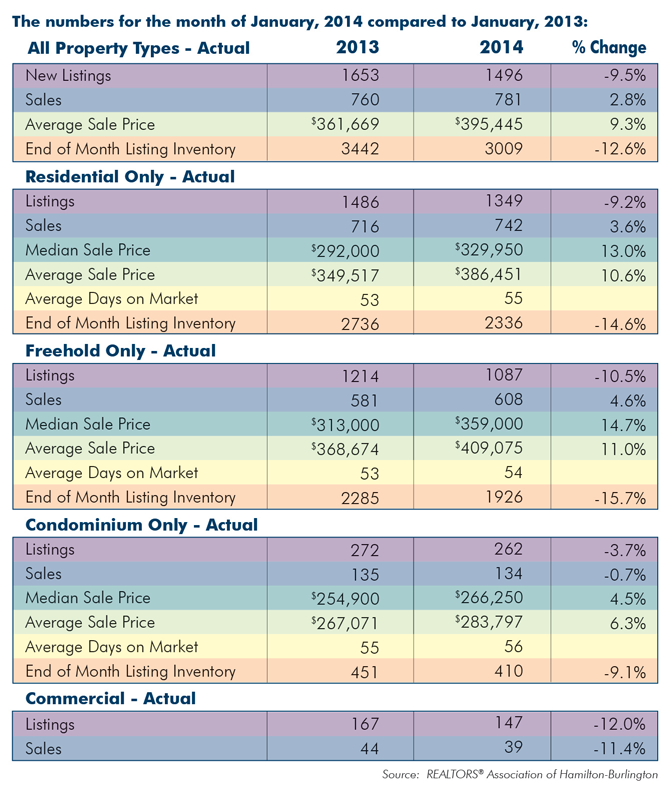
The REALTORS® Association of Hamilton-Burlington (RAHB) reported 781 property sales were processed through the RAHB Multiple Listing Service® (MLS®) system in January. This represents a 2.8 per cent increase in sales over January of last year.
There were 1496 properties listed in January, a decrease of 9.5 per cent from the same month last year. End-of-month listing inventory was 12.6 per cent lower than last year at the same time.
“The cold weather certainly didn’t keep buyers away,” said RAHB CEO Ross Godsoe. “Residential sales are higher than both last year and the average for the last ten years. The lower inventory of listings coming out of last year and lower-than-average new listings in January kept the seller’s market going.”
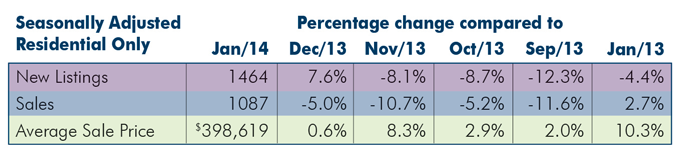
Seasonally adjusted* sales of residential properties were 2.7 per cent higher than the same month last year, with the average sale price up 10.3 per cent for the month. Seasonally adjusted numbers of new listings were 4.4 per cent lower than the same month last year.
Seasonally adjusted data for residential properties for the month
of January, 2014:
of January, 2014:
Actual overall residential sales were 3.6 per cent higher than the previous year at the same time. Residential freehold sales were 4.6 per cent higher than last year while the condominium market saw a decrease of just under one per cent in sales. The average price of freehold properties showed an increase of 11 per cent over the same month last year; the average sale price in the condominium market increased 6.3 per cent when compared to the same period last year.
The average sale price is based on the total dollar volume of all properties sold. Average sale price information can be useful in establishing long term trends, but should not be used as an indicator that specific properties have increased or decreased in value.
The average days on market increased from 53 to 54 days in the freehold market and from 55 to 56 days in the condominium market.
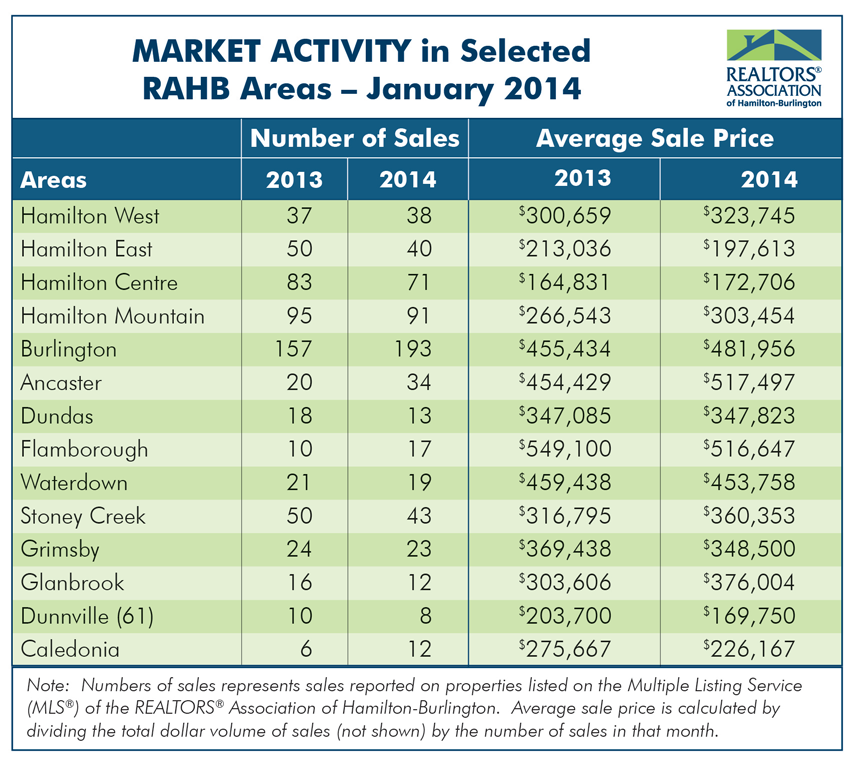
Every community in RAHB’s market area has its own localized residential market. Please refer to the accompanying chart for residential market activity in select areas in RAHB’s jurisdiction.
*Seasonal adjustment removes normal seasonal variations, enabling analysis of monthly changes and fundamental trends in the data.